[fusion_builder_container hundred_percent=”no” hundred_percent_height=”no” hundred_percent_height_scroll=”no” hundred_percent_height_center_content=”yes” equal_height_columns=”no” menu_anchor=”” hide_on_mobile=”small-visibility,medium-visibility,large-visibility” class=”” id=”” background_color=”” background_image=”” background_position=”center center” background_repeat=”no-repeat” fade=”no” background_parallax=”none” enable_mobile=”no” parallax_speed=”0.3″ video_mp4=”” video_webm=”” video_ogv=”” video_url=”” video_aspect_ratio=”16:9″ video_loop=”yes” video_mute=”yes” video_preview_image=”” border_size=”” border_color=”” border_style=”solid” margin_top=”” margin_bottom=”” padding_top=”” padding_right=”” padding_bottom=”” padding_left=”” admin_toggled=”no”][fusion_builder_row][fusion_builder_column type=”1_1″ layout=”1_1″ spacing=”” center_content=”no” link=”” target=”_self” min_height=”” hide_on_mobile=”small-visibility,medium-visibility,large-visibility” class=”” id=”” background_color=”” background_image=”” background_position=”left top” background_repeat=”no-repeat” hover_type=”none” border_size=”0″ border_color=”” border_style=”solid” border_position=”all” padding_top=”” padding_right=”” padding_bottom=”” padding_left=”” margin_top=”” margin_bottom=”” animation_type=”” animation_direction=”left” animation_speed=”0.3″ animation_offset=”” last=”no”][fusion_text columns=”” column_min_width=”” column_spacing=”” rule_style=”default” rule_size=”” rule_color=”” hide_on_mobile=”small-visibility,medium-visibility,large-visibility” class=”” id=””]
 Trading “around” a pivot is necessary if one is to avoid the bounce that often occurs when price approaches it.
A pivot is formed from a candle body, not at the high/low price associated with a wick.
A pivot is broken when 2/3 of the candle body breaches it to the upside or downside.
Few pivots function like this and an indicator like this is mandatory if a trader is to avoid trading into support or resistance.
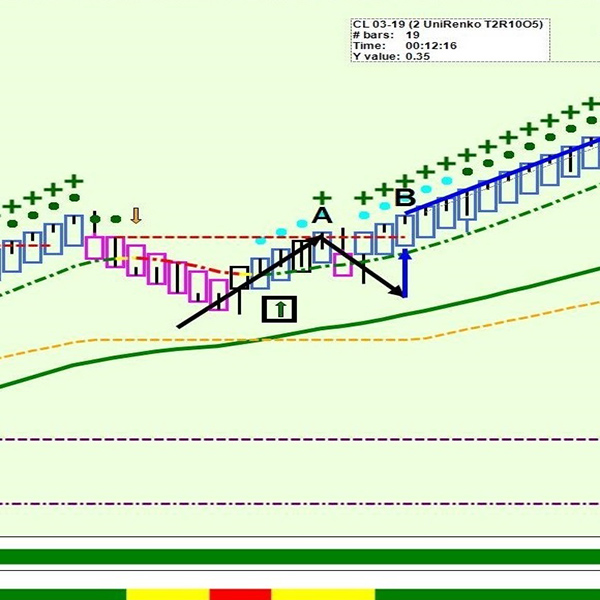
In the JPEG above, the dark black box shows a system generated long entry signal.
But the trade would take place right into a pivot (red dashed line).
Price hits point “A” at the pivot and bounces down (would have caused a stop out)
The pivot breaking candle “B” has its candle body 2/3 through the pivot to the upside.
The trade, taken will little risk goes 35 ticks.
The break in the pivot is oftentimes associated with a POP in price as the residual short traders in the pivot get stopped out.
At Right Line Trading we trade with a methodology that works day after day.
[/fusion_text][/fusion_builder_column][/fusion_builder_row][/fusion_builder_container]